 |
| Robert S. Landrebe is executive vice president of Gordon-Conwell Theological Seminary in South Hamilton, Massachusetts. He serves as one of In Trust's governance mentors. |
Most cars don't have a tachometer anymore. Remember the big dial, next to the speedometer, that indicated the speed of the engine's rotating shaft? You can still find them on some vehicles, but most drivers never really used the tachometer. With limited space on the dashboard, the tachometer just wasn't missed when it was left off.
At every school, financial information is presented regularly to presidents, administrative officers, and trustees. And key data taken from financial reports often serve as dashboard indicators, letting decision-makers know what is going on under the hood of the institution. But with limited time, theological school leaders need every indicator to be useful. Some leaders are especially adept at interpreting data from annual reports, but others become bogged down in the numbers. Important trends can go unnoticed while details loom large.
It's not that a school's annual financial statements are unimportant — they include the vital details that many users need. But as they are usually presented to trustees, financial statements don't make analyzing trends very easy.
In Trust Inc. is now testing a new tool that will use the information from audited financial statements but present data in a new way, facilitating financial assessments and big-picture thinking. Its purpose: to help schools achieve economic vitality by clarifying multiyear financial trends.
This analysis relies on a "revenue stream" approach that can give theological school leaders new confidence in allocating limited resources. At the micro level, the tool enables better decision-making about tuition pricing, educational delivery, teaching load expectations, and fundraising initiatives.
The tool is based on graphs that are created from standard financial data. Here's an advance peek at a few of those key graphs. Although these graphs are not extracted from a specific school's financial statements, the graphs are representative of real-life situations.
Defining major revenue streams
Figure 1 shows four major revenues streams used to support a school's operations. These revenue streams can be extracted from a school's audited financial statements.
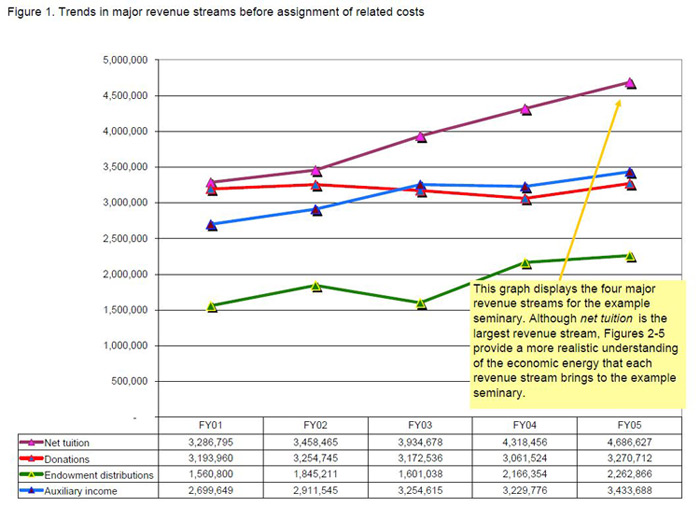
Net tuition
Tuition revenues minus financial aid. Financial aid = need-based financial grants and aid + merit-based scholarships. Financial aid is deducted from tuition revenues whether the financial aid is funded by donations or endowment distributions or represents a discount.
Donations
Unrestricted donations for operations (excluding unrestricted donations used for purchase and renovation of Figure 1. Trends in major revenue streams before assignment of related costs facilities) plus any donations released from restrictions that are used for operations.
Endowment distributions
Accumulated, unspent earnings and capital gains of the endowment funds authorized by trustees to be used for operating budget. Typically the endowment distribution is based on a spending rate that is expressed as a percentage of the school's endowment's market value, often averaged over a three-year period.
Auxiliary income
Gross revenues generated by seminary-owned apartments, dormitories, food service operations, bookstores, and summer programs (e.g. camps). This income is shown before any costs attributable to the auxiliary revenues.
Interpreting the general trends of revenue streams
Any one of the four major revenue streams may include many contributing revenue streams. So it's possible that a major revenue stream may have contributing streams that are trending in an opposite direction or at much greater or lower rates than the average change. For example:
Net tuition likely includes revenues from multiple degree programs and even more than one campus or extension site. So it is important to understand how each contributes to the overall net tuition revenue stream. How much of the change in each contributing net tuition revenue stream is attributable to increasing tuition rates? To changes in financial aid provided? To changes in average course registrations per student per year? To changes in student headcount?
| Look for In Trust's new financial self-assessment tool to roll out later this year. These sample graphs are a preview of the tool, which will provide a much more expansive set of graphs, explanatory notes and practical tools for theological school leaders. |
Donation income trends must be analyzed at a more detailed level, especially by donor type and activity. Under donor type, examine giving trends for individuals, churches, foundations, denominations, and other groups. Under activity, investigate which activities motivated which gifts. What are the trends in giving in response to direct mail, phone campaigns, special events, foundation proposals, and major donor initiatives? At this summary level, the donation income trends simply show the aggregate results, while the underlying "donor type" and "activity" analysis can reveal varied strengths, weaknesses, and opportunities.
Because a variety of auxiliary enterprises are at work within a school, the trend line for this auxiliary income revenue stream hides important details relative to the various contributing revenues streams (from bookstore, food service, dormitories, apartments). For example, a school may find that increasing competition from online providers is causing a decline in bookstore revenues, but food service revenues continue to grow due to rate increases and usage increases.
Digging deeper
In most cases, growth in the trend lines is favorable. However, because of the complexities related to (1) net tuition calculations and (2) the nature of fund accounting, it is possible for the trends in major revenue streams to appear more favorable than the true, underlying economics that are at work. A few examples may help:
If net tuition revenues are growing but overall enrollment is stagnant, then a greater financial burden is being placed on the students. This practice may be desirable if either (1) the school's tuition rate was too low historically or (2) the school's financial aid practices had been too generous. However, if the school's net tuition rate (tuition rate less financial aid) is becoming too great in comparison to peer schools, the long-term impact on student recruitment may suffer.
The trend line for endowment distributions can also appear to be more favorable than desirable if the school has adopted a spending rate that is too great in relation to long-term investment performance and the ability to acquire new gifts for the corpus. A healthy increase in the endowment distributions should mirror a healthy growth in the overall endowment assets. Otherwise, the school will be slowly eroding the value of its endowment funds.
The ultimate goal: evaluating causes for changes in net revenue streams
Figures 2–5 provide a very different perspective on the economic impact of each major revenue stream. Most financial statements prepared for seminaries list and then subtotal all of the operating revenues together — revenues like net tuition, donation income, distributions (or earnings) from endowments, and auxiliary income. Then, all of the operating costs are listed with a subtotal, normally showing "expenses by function" such as costs for instruction, library, academic services, management and general, auxiliary enterprises, and fundraising. This approach leaves the readers of seminary financial statements without a clear understanding of the true interaction of revenue streams with their related costs.
The ultimate purpose in this analysis is not to determine whether a school's major revenue stream is net positive or net negative, but rather to understand the trend lines. How are major revenues streams, net of costs, changing over time? The related graphs display the gross margin of a school's major revenue streams.
Interpreting general trends in net revenues streams
Four key findings can be extracted from audited financial statements as shown in Figures 2–5. Looking at gross margins of the major revenue streams helps explain which revenue streams are (1) generating the greatest contribution to overhead (or requiring the greatest support from other sources), (2) improving over time, and (3) most reliable for budget planning purposes. The final figure shows the apparent interchangeability among the revenue streams for planning purposes.
Figure 2: The importance of each revenue stream
This graph highlights how important each revenue stream is to the support of operating costs. Some revenue streams (especially net tuition and auxiliary income) may be net negative (i.e., the underlying costs to support the revenue stream are not sufficient without other revenue sources). To make things as simple as possible, this analysis only shows instructional costs as a deduction against net tuition. A strong argument can be made that costs such as academic support or libraries should be included as well. But for the purposes of this exercise, it is useful to gain an understanding of the most basic relationship of delivering instructional services against the net tuition earned from students who are sitting in the classroom.
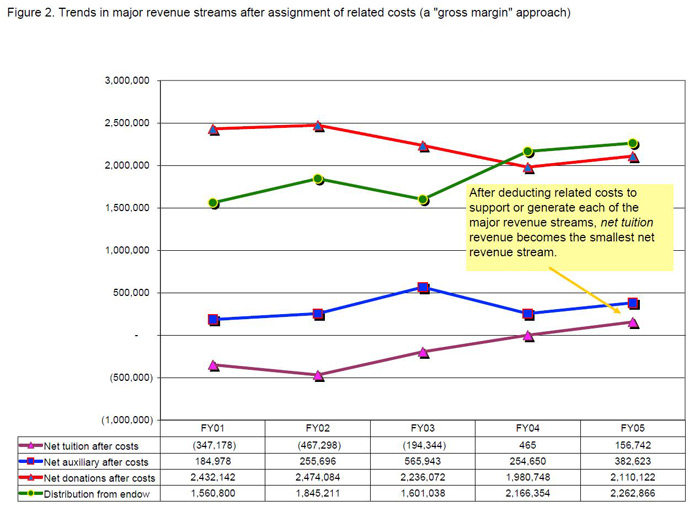
Figure 3: Improvements in each revenue stream
This graph shows the cumulative improvements in an institution's major revenue streams from the base year of the study. For example, if an auxiliary enterprise's gross margin improved from a loss of $200,000 to a loss of only $50,000, the managerial focus needed to achieve this result would have been just as favorable as increasing donations, after costs, by another $150,000. Figure 3 shows the extent by which a school is creating new economic energy through management of its major revenue streams, net of costs.
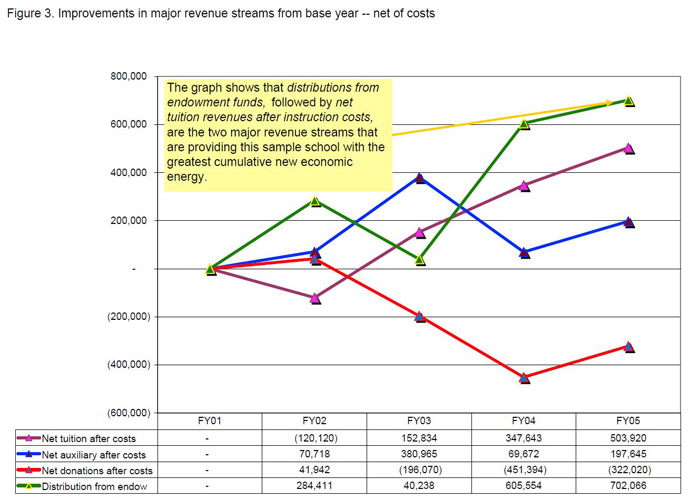
Figure 4: Reliability of each revenue stream
Some revenues streams are easier to predict than others. In many cases, the donation income stream is the most difficult to project. This graph shows the annual change and relative volatility in the gross margin for each major revenue stream. If this graph shows an inconsistent pattern of increases and decreases, the revenue stream is less reliable for budget planning purposes. Any planned growth for such a revenue stream will carry increased risk and require increased managerial focus and attention.
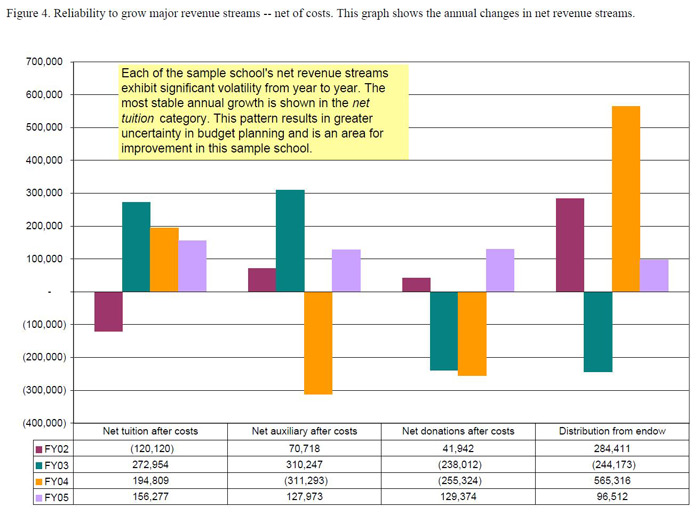
Figure 5: Interchangeability of each revenue stream
This graph provides trustees with an understanding of the school's ability, on a year-to-year basis, to generate the necessary overall gross margins from their major revenue streams, ensuring that enough revenues are available to support increasing operating costs. This graph shows the degree of flexibility among the net revenue streams to offset shortfalls in certain net revenue streams with increasing gains in other net revenue streams.
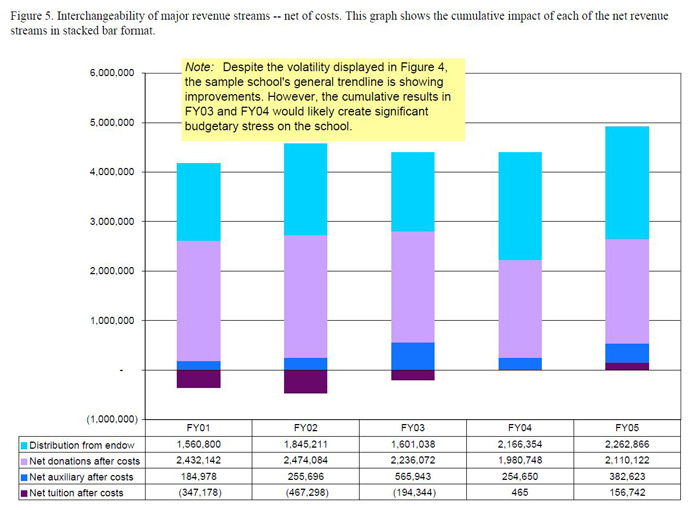
In many instances, schools have used endowment funds as the balancing resource, which can lead to higher than desired spending levels — a short-term solution that creates longer-term problems. In other situations, donation income can be utilized as the buffer to offset unplanned shortfalls in net tuition or auxiliary income.